Traders often struggle to identify reliable trends in the market. Many get caught chasing price movements without a clear plan, leading to losses and frustration. Pinpointing strong setups can feel overwhelming, especially when markets are unpredictable.
One important element of bullish trading is recognizing higher lows on a price chart. Higher lows suggest that buyers are gaining control and pushing the market upward over time. This pattern serves as an early indication for potential profits during uptrends.
In this blog, you’ll learn how to apply higher lows effectively in your trading strategy. From identifying them on charts to confirming with indicators, we will cover it all step by step.
Keep reading to enhance your skills in building bullish setups!
What Are Higher Lows in Trading?
Higher lows occur when the price of an asset drops but does not fall below its previous low. Each successive low is higher than the one before, forming a staircase-like pattern on a chart.
This pattern suggests strength in the market and often points to increasing buying activity. Higher lows typically indicate that traders are entering the market earlier to buy, stopping further declines.
This trend is common in bullish setups and can assist in identifying potential support levels for future price movements.
Importance of Higher Lows in Bullish Setups
Higher lows signal strong buying interest and growing market momentum. They occur when buyers step in at progressively higher price points during pullbacks. This pattern often shows that demand outweighs supply, creating a foundation for continued upward movement.
By recognizing these formations, traders can identify areas of support where the bulls regain control, strengthening confidence in future price growth.
Rising lows also help confirm the presence of a bullish trend. Consistent higher lows suggest steady accumulation as more participants enter the market with optimism. Combining this with key technical indicators, such as moving averages or RSI, offers additional confirmation for trade entries.
As prices rebound from support levels during pullbacks, well-timed strategies based on higher low setups can provide advantageous opportunities for both beginner and advanced traders alike.
Identifying Higher Lows on Price Charts
Identify increasing low points on charts by observing steady upward price movements and monitor possible bullish trends.
Key chart patterns to watch for
Recognizing chart patterns helps traders identify increasing support levels effectively. These patterns can point to potential buy opportunities during upward market trends.
- Double bottom patterns occur when prices form two distinct lows at nearly the same level before rising. This pattern highlights strong support and a possible upward reversal.
- Ascending triangles show price consolidations with increasing support levels meeting horizontal resistance. A breakout above resistance confirms upward trend continuation.
- Bull flags form after steep price rises, followed by minor downward consolidations resembling a flag shape. The upward breakout often indicates continued movement in the bullish trend.
- Cup-and-handle patterns arise when prices create a rounded base (cup) followed by a brief consolidation (handle). A breakout from the handle reflects growing buying interest.
- Falling wedge patterns consist of declining prices forming converging trendlines with increasing support levels. Breaking above the wedge points to potential for an upward move.
- Inverse head-and-shoulders appear when three consecutive troughs form, with the middle one being the lowest. The neckline’s upward break signals a shift toward positive momentum.
- Rounded bottoms occur as prices gradually transition from declines to steady gains over time, creating smooth curves on charts. They indicate market strength preparing for further upward movements.
- Trendlines connecting increasing support levels offer visual confirmation of an upward trend’s strength and direction over various time frames.
- Candlestick reversals like hammer candles at key support levels highlight areas where buyers start gaining control, inspiring confidence in setups matching increasing support levels.
- Support zones identified through horizontal lines or Fibonacci retracements provide insight into levels where prices may rebound, creating dependable entry points during positive market phases.
Role of time frames in analysis
Analyzing key chart patterns requires understanding the role of time frames. Different time frames reveal varying trends and provide valuable insights into market momentum.
Short-term charts, such as 5-minute or hourly charts, emphasize immediate price action for active traders. Longer time frames, like daily or weekly charts, help identify stronger upward trends and support levels.
“Higher lows on larger time frames often signal a more dependable trend,” emphasizes many analysts focusing on technical analysis.
Indicators to Confirm Higher Lows
Traders use technical indicators to confirm higher lows and improve their trade setups.
Moving Averages
Moving averages assist traders in recognizing higher lows in an upward trend. They simplify price data over specific periods, forming an average line on the chart. For instance, the 50-day and 200-day moving averages often emphasize trends and momentum changes.
An upward moving average indicates increasing market momentum. If prices rebound from this line or remain above it while forming higher lows, it reinforces a bullish setup. Using moving averages alongside other indicators enhances the consistency of trading signals in technical analysis.
Relative Strength Index (RSI)
The Relative Strength Index (RSI) helps traders evaluate market momentum. It indicates whether an asset is overbought or oversold, offering potential buy or sell signals. RSI values range from 0 to 100, with readings above 70 suggesting overbought conditions and below 30 indicating oversold levels.
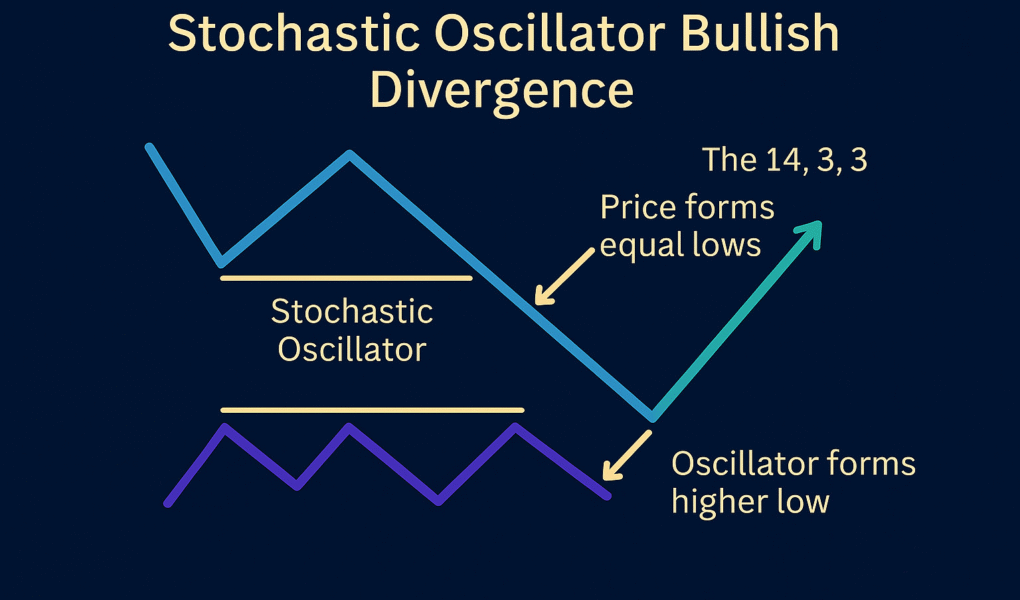
Traders can analyze RSI divergence to confirm higher lows during a bullish trend. For example, when the price forms higher lows but the RSI reflects lower lows, it may signal a strong upward move ahead.
This tool is effective when paired with other technical indicators like MACD for improved accuracy.
MACD Indicator
The RSI focuses on momentum, but the MACD Indicator analyzes trends and potential reversals. MACD stands for Moving Average Convergence Divergence. This tool helps traders identify changes in upward trends by comparing two moving averages of a stock’s price.
Observe the signal line and histogram for confirmation of higher lows. A bullish crossover occurs when the MACD line moves above the signal line, signaling upward momentum. Pay attention to differences where price action forms higher lows, but the MACD behaves differently; this can reveal possible weakness or strength within market momentum.
Trading Strategies Using Higher Lows
Use ascending minimal price points to identify potential entry opportunities during an uptrend. Pair them with solid price movement for improved trade setups.
Trend-Following Strategy
Focus on the upward trend by identifying rising lows during price movement. Rising lows indicate steady buying interest and the possibility of continued upward movement. Traders can rely on this approach to join an ongoing trend rather than predicting reversals.
Combine tools like moving averages with price action for accurate entries. For instance, a 50-day moving average crossing above a 200-day average indicates strong market movement. Place stop-loss orders beneath the most recent rising low to control risk while staying aligned with the trend effectively.
Breakout Strategy
A breakout strategy focuses on recognizing price movement beyond essential support or resistance levels formed by higher lows. Traders observe bullish trends when the price moves above resistance, as this signifies strong market momentum.
Use technical indicators like Moving Averages or RSI to verify breakouts and reduce the chances of false signals. Combine chart patterns, such as ascending triangles, with increased volume to enhance trade setups.
Place stop-loss orders below recent higher lows for disciplined risk management.
Fibonacci Retracement for Entry Points
Using Fibonacci retracement levels can support traders in identifying entry points during pullbacks in bullish trends. These levels serve as potential support zones, providing opportunities to enter trades more accurately.
- Identify the recent swing high and swing low on the price chart to plot Fibonacci levels correctly. Focus on clear and established price movements for better consistency.
- Refer to key Fibonacci ratios such as 38.2%, 50%, and 61.8% to find potential retracement areas. These are frequent zones where price may reverse or bounce upward.
- Monitor if the price aligns with support levels near a Fibonacci ratio. This combination enhances the likelihood of a bullish setup.
- Combine Fibonacci retracement zones with candlestick patterns like hammers or engulfing candles to confirm reversals.
- Evaluate market momentum with technical indicators like RSI or MACD near these levels. Positive divergence can reinforce potential buy signals at these retracement areas.
- Position your stop-loss slightly below the next lower level or a previous swing point to effectively manage risk.
- Wait for price action confirmation before entering trades at retracement levels instead of placing orders prematurely in expectation of bounces.
- Use this strategy on multiple time frames to improve accuracy and minimize noise in analysis for both short-term and long-term trading approaches.
Risk Management in Higher Low Setups
Traders must handle risks carefully when trading higher low setups. Always prioritize safeguarding capital while preparing each trade.
Placing stop-loss levels
Place stop-loss levels just below the most recent higher low in a bullish trend. This ensures you exit trades if the price moves against your expectations, safeguarding your capital.
Use technical analysis tools like Fibonacci retracement or support levels to improve stop-loss placement. For example, set stops slightly below key support zones or candlestick patterns indicating reversals.
Position sizing for risk control
Stop-loss levels safeguard against unforeseen market movements, while position sizing aids in maintaining overall risk management. Adjust the size of each trade based on your account balance and the amount you are prepared to lose.
For instance, risking 1-2% per trade is a typical guideline among traders. If your account contains $10,000 and you risk 2%, cap potential loss at $200. Determine this by dividing your stop-loss distance in dollars into the allowed risk amount.
Smaller positions limit exposure during volatile markets while keeping losses under control.
Common Mistakes to Avoid
Traders often make mistakes when using higher lows in bullish setups. Avoiding these errors can improve your trading strategy and risk management.
- Ignoring overall market trends damages analysis. Always check if the market aligns with your bullish thesis.
- Relying on one time frame narrows perspective. Analyze multiple time frames to confirm higher lows.
- Misinterpreting price patterns leads to increased losses. Ensure you correctly identify valid higher low formations.
- Overlooking technical indicators diminishes signals. Use tools like RSI or MACD for confirmation of trends.
- Placing stop-loss levels too tight causes premature exits. Leave room for minor price fluctuations.
- Neglecting support and resistance levels distorts entries. Verify these zones before setting trade positions.
- Entering trades late limits profit potential. Identify higher lows early to act at the right time.
- Risking too much capital on one trade heightens exposure. Stick to proper position sizing rules consistently.
- Failing to account for false breakouts leads to confusion. Wait for solid confirmation before entering trades.
- Letting emotions dominate strategy results in poor decisions. Follow your trading plan without hesitation or fear.
Advanced Tips for Using Higher Lows in Trading
Avoiding mistakes helps enhance trading skills, but advanced techniques can enhance results even further. Focus on combining higher lows with strong candlestick patterns like bullish engulfing or hammer formations.
These signals reinforce the validity of support levels and confirm upward momentum in price action.
Apply volume analysis to validate higher lows during a trend. Increasing volume near support levels highlights buyer interest and suggests continued upward movement. Include indicators like RSI divergence for early signs of potential reversals when paired with higher lows on charts.
Conclusion
Trading with higher lows offers a clear path to spotting bullish trends. It integrates price movement, support levels, and technical indicators for improved understanding. Emphasize proper risk management to safeguard your capital.
Practice recognizing patterns and enhancing strategies over time. Confidence increases as you excel in this method within trading setups.